
With the rise of Allow Lists, it is becoming harder and harder to make profit from minting. You practically need to be an olympic gymnast (or hire a VA) nowadays just to get the privilege of minting 1 token. Well, you don’t always have to mint an NFT project to make profit. However, buying on secondary can be a lot more tricky than being successful on a mint. Why? When you mint a hyped drop, you already have that demand sitting there ready for you to sell into. When you buy on secondary you need to look out for the right signals to get in and out without too many battle scars.
How to Momentum Trade NFTs
So what exactly do I mean by momentum trading? It’s simply buying low and selling high. However, you aren’t just doing this on a whim. Rather, you are looking for a sign that momentum is about to kick off, that’s when you buy. You’ll then be watching the charts for the top signal, that’s when you sell. These momentum trades are not long term holds – these are short term flips. We’ll go into more specifics on how to do this successfully throughout this article.
The Entrance: When to Buy In
The buy in, the grand entrance into the battlefield. Many naive traders fuck up and run into the middle of an ambush at the very beginning. It’s not easy to time unless you know what to look out for. When I first started out, I would eyeball the OpenSea activity feed. Whilst not the best option, it is definitely a good alternative to using a paid analytics tool (which we’ll discuss later).
In order to eyeball the activity feed, you need to go to the ‘Activity Feed’ of a project on OpenSea, that is seeing considerable volume. You then watch the listings and the sales and take note of the listing prices and the sales prices.
 As you watch, you’ll be able to eyeball and get an approximate indication of whether listings are outpacing sales and whether the price at which sellers are listing at is creeping up or down in comparison to the speed of sales per minute coming in.
I’d advise just spending some time watching projects with high volume and observing, you’ll pick it up way quicker than you may think. Before long you’ll do fairly well timing the bottom and the top.
Incase you dont know how to get to the activity feed, just go the the collection page on OpenSea and click ‘activity’. The URL will look like this example of the current top trending NFT at the time of writing, Super Ordinary Villains: https://opensea.io/collection/super-ordinary-villains-genesis?tab=activity
Your aim is to buy in at the start of the increase in volume and then sell just before it starts to reach an equilibrium.
If you get greedy and hold out too long, you will end up catching knives and chasing the floor. Don’t be greedy.
Note: The higher the volume of sales, the more wiggle room you have. If volume is too low, a small decrease in volume can leave you bag holding. If volume is high, you have more time to adjust and sell into the momentum.
Visualisation of How Momentum Trading Works
Hands down, the best tool I have used for this type of trading is NFT Nerds. I am using it as an example to delve in deeper than the eyeballing example above. Whilst not endorsed, I do recommend this if you have the funds and are looking to invest in a tool. At least at the time of writing. Let’s go in to more detail:
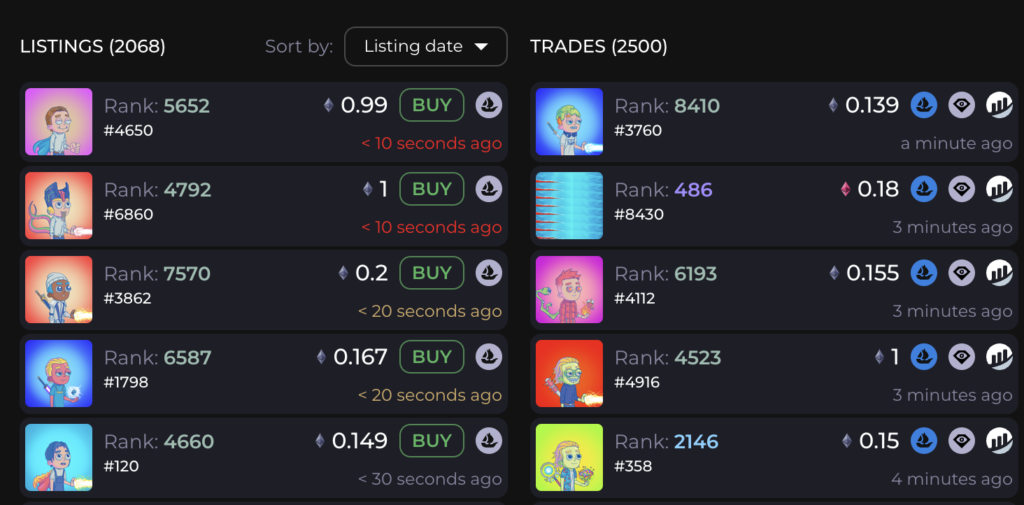
1. Here you can see the sales and listings placed side by side, easy to watch, and updating second by second. With this you can see how often items are being listed as well as the price, and very quickly see how they compare. Why is this important? If listings per minute are speeding up compared to sales per minute then we know momentum is shifting with downwards pressure. It is time to think about selling. We should also make a second check, at what price are sales coming in and and at what price are listings coming in at? Even if listings are coming in faster than sales, if those listings are all at prices much higher than floor then I am less concerned than if they were at or below floor. Also take note of the number inside the brackets. You can see 2068 and watch in real time if this goes up or down, therefore knowing if sales are outpacing listings or not. If sales are outpacing listings, wait, if listings are outpacing sales, you have a sell signal:
 2. To see this in a graphical environment, we can look at this chart. You can clearly see where the top (sell points) and bottoms (buy points) are. The trick is to never be greedy and if you feel the top is approaching, sell. If you try to hold on for too long it can be a very fast trip down.

3. Another factor to consider is ‘how thin is the floor’. This basically refers to, how many listings are there up to your sell target. If you find a project that has a fairly low floor but after investigation you see it has very few listings up to a respectable exit price, then you know if this starts to see volume where sales exceed listings, you’ll be able to reach your exit target with ease. These kind of projects are always good to keep an eye on. SupDucks are a great example that seem to often have a very thin floor and can 1.5-2x very quickly on a single uptrend (this may be different at the time of reading). Here is an example of the ladder showing thinness of the floor:

In Conclusion
One thing easy to trip up on is taking an emotional stance to a project and not buying in because you just don’t like the art etc. I have made that mistake before many times. The lesson I learned was that the charts do not lie. You should get better at interpreting and trusting the data than interpreting sentiment, because data rarely lies.